Delving into the intricacies of the Treasury yield curve, this explanation sheds light on how it impacts financial markets and guides investment decisions with its unique calculations and relationship to interest rates.
Exploring the various types of yield curves, historical patterns, and their implications on the economy, this overview provides a comprehensive understanding of this crucial financial indicator.
Introduction to Treasury Yield Curve

The Treasury yield curve is a graphical representation of the yields on U.S. Treasury securities across different maturities, ranging from short-term to long-term. It is a crucial indicator in the financial markets, providing valuable insights into the state of the economy and expectations for future interest rates.
Calculation of Treasury Yield Curve
The Treasury yield curve is calculated by plotting the yields of Treasury securities of varying maturities, such as 3-month, 2-year, 5-year, 10-year, and 30-year bonds. These yields are then connected to form a curve that illustrates the relationship between interest rates and time to maturity.
Relationship between Treasury Yield Curves and Interest Rates
The shape of the Treasury yield curve can provide information about market expectations for interest rates. For instance, a steeply sloping yield curve typically indicates expectations of future economic growth and higher interest rates, while an inverted yield curve may signal an impending economic slowdown or recession. Investors closely monitor changes in the Treasury yield curve to make informed decisions about investments and assess the overall health of the economy.
Types of Yield Curves

In the world of finance, yield curves are essential tools used to gauge the economic outlook. There are three main types of yield curves: normal, inverted, and flat. Each type provides valuable insights into the state of the economy and helps investors make informed decisions.
Normal Yield Curve
A normal yield curve is characterized by long-term interest rates being higher than short-term rates. This indicates that investors expect the economy to grow steadily in the future. Historically, normal yield curves have been the most common type. For example, during periods of economic expansion, such as the mid-2000s, normal yield curves were prevalent.
Inverted Yield Curve
On the other hand, an inverted yield curve occurs when short-term interest rates are higher than long-term rates. This phenomenon is often seen as a warning sign of an impending recession. One of the most notable occurrences of an inverted yield curve was in 2007, just before the financial crisis of 2008.
Flat Yield Curve
When the yield curve is flat, it means that there is little difference between short-term and long-term interest rates. This could signal uncertainty in the market about the future economic outlook. In recent years, there have been concerns about a flattening yield curve and its implications for the economy.By understanding the different types of yield curves and their implications, investors and economists can better assess the health of the economy and make informed decisions about their investments.
Factors Influencing the Treasury Yield Curve
The shape of the Treasury yield curve is influenced by various factors, reflecting the relationship between interest rates and the maturity of Treasury securities. Understanding these factors is crucial for investors and policymakers alike.
Economic Indicators Impact
Economic indicators such as inflation and unemployment play a significant role in shaping the Treasury yield curve. Inflation erodes the purchasing power of fixed-income investments, leading to higher yields on longer-term Treasury securities to compensate for the loss in real value. On the other hand, high unemployment rates may signal economic weakness, prompting investors to seek the safety of shorter-term Treasuries, thus affecting the yield curve.
Monetary Policy Influence
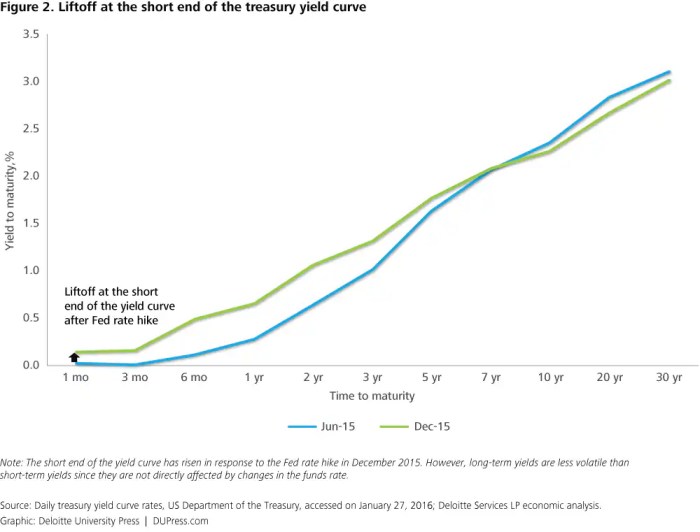
Monetary policy decisions by the Federal Reserve also impact the Treasury yield curve. When the Fed raises interest rates to curb inflation, short-term Treasury yields tend to increase more than long-term yields, causing the yield curve to flatten or even invert. Conversely, during periods of economic downturn, the Fed may lower rates to stimulate growth, leading to a steeper yield curve as long-term yields rise relative to short-term yields.
Uses of Treasury Yield Curve Analysis
Investors and analysts utilize the Treasury yield curve extensively to make informed investment decisions based on the current and future state of the economy.
Signaling Potential Economic Downturns or Recessions
- The shape of the yield curve can act as a leading indicator of economic conditions. An inverted yield curve, where short-term yields are higher than long-term yields, is often seen as a sign of an impending recession.
- By analyzing the yield curve, investors can gauge market sentiment and adjust their portfolios accordingly to mitigate risks associated with economic downturns.
- Historically, instances of yield curve inversion have been followed by economic contractions, making it a crucial tool for predicting recessions.
Examples of Predicting Market Trends
- During the 2008 financial crisis, the inversion of the yield curve accurately foreshadowed the economic turmoil that followed, prompting investors to take defensive measures to protect their assets.
- Conversely, a steepening yield curve, where long-term yields rise relative to short-term yields, can indicate expectations of economic growth, influencing investment strategies favoring riskier assets.
- By closely monitoring the Treasury yield curve, analysts can identify trends in interest rates, inflation expectations, and overall market sentiment, providing valuable insights for decision-making in various asset classes.
In conclusion, the Treasury yield curve serves as a valuable tool for investors and analysts to navigate market trends, anticipate economic shifts, and make informed decisions in a dynamic financial landscape.
FAQ Explained
What is the significance of the Treasury yield curve?
The Treasury yield curve is crucial in indicating the relationship between short-term and long-term interest rates, providing insights into market expectations and economic conditions.
How is the Treasury yield curve calculated?
The Treasury yield curve is calculated by plotting the yields of U.S. Treasury securities with different maturities, typically ranging from 1 month to 30 years.
What do different types of yield curves indicate?
Normal yield curves suggest a healthy economy, inverted yield curves may signal an impending recession, and flat yield curves indicate economic uncertainty.


