Exploring the concept of the inverted yield curve, we delve into its implications on financial markets, providing a comprehensive overview that sheds light on this intriguing phenomenon.
From defining the inverted yield curve to analyzing its impact on the economy, this discussion offers valuable insights into a key indicator for investors and analysts alike.
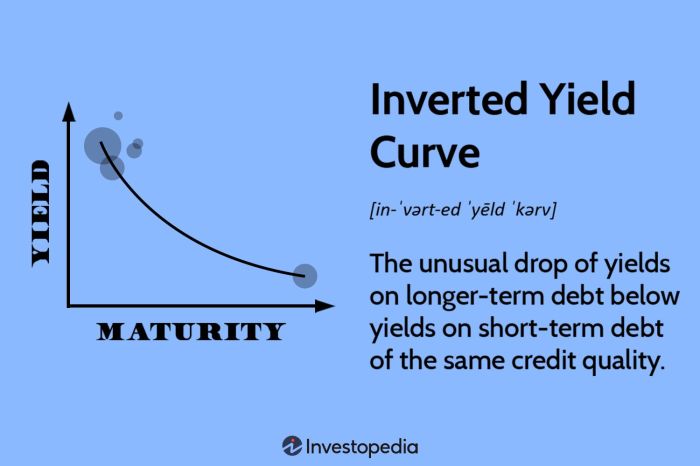
Inverted Yield Curve Meaning

An inverted yield curve occurs when the interest rates on short-term bonds are higher than the interest rates on long-term bonds. This phenomenon is closely monitored by analysts and investors as it is often seen as a potential indicator of an impending economic downturn.
Interpretation by Analysts and Investors
Analysts and investors interpret an inverted yield curve as a sign of investor concern about the future state of the economy. It is believed that when long-term interest rates are lower than short-term rates, it reflects a pessimistic outlook on economic growth and inflation. This inversion can lead to a decrease in lending activity and investments.
Implications on the Economy and Future Interest Rates
The implications of an inverted yield curve on the economy can be significant. It may signal a potential recession in the near future, as it has been a reliable predictor of economic downturns in the past. Additionally, an inverted yield curve can impact future interest rates by influencing the decisions of central banks and policymakers.
Historical Instances of an Inverted Yield Curve
One notable historical instance of an inverted yield curve occurred in 2006 before the 2008 financial crisis. Another example is the inversion in 2019, which raised concerns about a possible economic slowdown. These instances serve as reminders of the importance of monitoring the yield curve as a potential warning sign for the economy.
Yield Curve Overview
Understanding the yield curve is crucial in the realm of finance as it provides valuable insights into the economy’s future performance. The yield curve is a graphical representation of the interest rates on bonds of different maturities issued by the government. It shows the relationship between the interest rate (or yield) and the time to maturity, helping investors gauge the market’s expectations and economic conditions.
When constructing a yield curve, bond yields of varying maturities are plotted on a graph, with the x-axis representing the time to maturity and the y-axis displaying the corresponding yields. By connecting these data points, a curve is formed, reflecting the current interest rate environment and market sentiment.
Normal Shape of the Yield Curve and Economic Implications
The normal shape of the yield curve is upward-sloping, indicating that long-term bonds have higher yields than short-term bonds. This typical pattern suggests that investors expect higher returns for locking in their funds for a longer period, reflecting confidence in future economic growth.
Such a yield curve shape is associated with a healthy economy, where growth is expected to continue steadily. It signifies that investors are optimistic about the future and are demanding higher compensation for the risks associated with longer-term investments.
Types of Yield Curves
- Normal Yield Curve: An upward-sloping yield curve where long-term yields are higher than short-term yields. It indicates a healthy economy and positive investor sentiment.
- Flat Yield Curve: A flat yield curve occurs when short-term and long-term yields are similar. This shape suggests uncertainty in the market and can be a precursor to an economic slowdown.
- Inverted Yield Curve: An inverted yield curve is when short-term yields are higher than long-term yields. This curve shape is often seen as a warning sign of an impending recession, as investors may be anticipating a downturn in the economy.
In conclusion, the inverted yield curve serves as a critical signal for understanding market trends and predicting future interest rates, making it a fundamental concept in the realm of finance.
FAQ Compilation
What is the significance of an inverted yield curve?
An inverted yield curve often indicates an impending economic downturn, as short-term interest rates surpass long-term rates.
How do analysts interpret an inverted yield curve?
Analysts view an inverted yield curve as a signal of potential recession, prompting caution in investment decisions.
Can you provide an example of historical instances of an inverted yield curve?
Historical instances of an inverted yield curve include the periods preceding major economic recessions, such as the one before the 2008 financial crisis.


