Embark on a journey into the world of yield curves with this beginner-friendly guide, shedding light on a complex financial concept in a way that is both informative and accessible.
Explore the intricacies of yield curves, from their significance in investment decisions to their role in predicting economic trends.
Introduction to Yield Curve
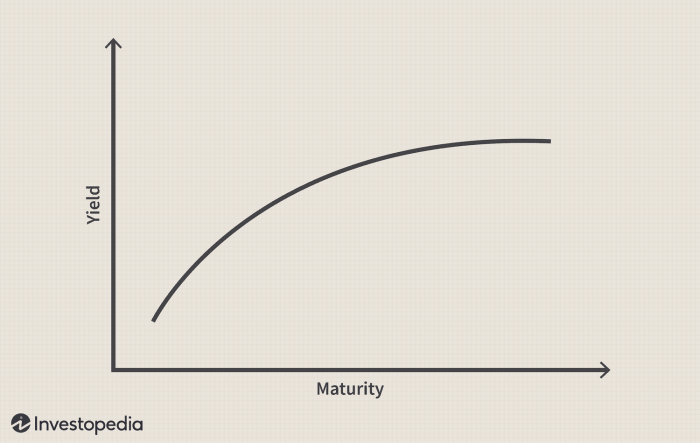
A yield curve is a graphical representation of the interest rates on debt for a range of maturities. It shows the relationship between the interest rate and the time to maturity for a specific debt instrument, typically government bonds.
Understanding the yield curve is crucial for investors as it provides valuable insights into the state of the economy, interest rates, and potential market trends. By analyzing the shape and movement of the yield curve, investors can make informed decisions about asset allocation, risk management, and investment strategies.
Importance of Yield Curve for Investors
- The yield curve helps investors assess the overall health of the economy. A steep yield curve indicates expectations of strong economic growth, while an inverted yield curve may signal an impending recession.
- Investors use the yield curve to anticipate changes in interest rates set by central banks. A flattening yield curve could indicate expectations of rate cuts, while a steepening yield curve may suggest rate hikes.
- By monitoring the yield curve, investors can adjust their portfolios to optimize returns and minimize risks based on the prevailing economic conditions and interest rate expectations.
Using Yield Curve to Gauge Economic Outlook
The yield curve serves as a reliable indicator of the market’s sentiment and expectations regarding future economic conditions. Here are some key ways in which investors use the yield curve to gauge the economic outlook:
- Normal Yield Curve: Typically upward-sloping, with long-term interest rates higher than short-term rates, indicating expectations of economic expansion.
- Flat Yield Curve: Short-term and long-term interest rates are similar, suggesting uncertainty or a potential economic slowdown.
- Inverted Yield Curve: Short-term interest rates exceed long-term rates, often seen as a precursor to a recession as investors anticipate lower future returns and economic challenges.
Types of Yield Curves

When it comes to yield curves, there are three main types that are commonly observed in the market – normal, inverted, and flat. Each type signifies different market conditions and can provide valuable insights for investors and analysts.
Normal Yield Curve
A normal yield curve is characterized by longer-term interest rates being higher than shorter-term interest rates. This type of yield curve typically indicates that the market expects economic growth in the future. It suggests that investors are demanding higher returns for locking in their money for a longer period, anticipating higher inflation or increased economic activity. An example of a normal yield curve can be seen when the 10-year Treasury yield is higher than the 2-year Treasury yield.
Inverted Yield Curve
An inverted yield curve, on the other hand, occurs when shorter-term interest rates are higher than longer-term interest rates. This type of yield curve is often seen as a warning sign of an impending economic recession. It indicates that investors are seeking the safety of longer-term bonds, which drives down their yields. One historical instance of an inverted yield curve is the one that occurred before the 2008 financial crisis, where the 2-year Treasury yield was higher than the 10-year Treasury yield.
Flat Yield Curve
A flat yield curve happens when there is little difference between short-term and long-term interest rates. This type of yield curve can signal uncertainty in the market about future economic conditions. It may indicate a potential slowdown in economic growth or lack of consensus among investors about the direction of interest rates. An example of a flat yield curve can be observed when the 5-year Treasury yield is similar to the 10-year Treasury yield.
Factors Influencing the Yield Curve
The shape of the yield curve is influenced by various factors that reflect the overall economic environment and market conditions. Understanding these key factors is crucial in interpreting the signals that the yield curve provides about the economy.
Inflation and Interest Rates
Inflation and interest rates are two primary factors that significantly impact the shape of the yield curve. When inflation is high, central banks tend to raise interest rates to curb inflationary pressures. As a result, long-term interest rates may rise more than short-term rates, leading to an upward-sloping yield curve. Conversely, when inflation is low, central banks may lower interest rates, causing short-term rates to fall more than long-term rates, resulting in a downward-sloping yield curve.
Market Expectations and Investor Sentiment
Market expectations and investor sentiment also play a vital role in shaping the yield curve. If investors anticipate strong economic growth in the future, they may demand higher yields on long-term bonds, leading to a steep yield curve. Conversely, if there are concerns about a potential economic downturn, investors may flock to the safety of long-term bonds, pushing their prices up and yields down, resulting in a flat or inverted yield curve.
Yield Curve Shapes and Their Implications

Understanding the different shapes of the yield curve is essential for investors and economists alike as they provide valuable insights into the state of the economy and can help predict future trends.
Steep Yield Curve
A steep yield curve, where the spread between short-term and long-term interest rates is significant, typically indicates expectations of strong economic growth. This shape of the yield curve can benefit banks and financial institutions, as they can borrow at lower short-term rates and lend at higher long-term rates, thus increasing their profit margins. It also encourages borrowing and investment, driving economic expansion.
Flat Yield Curve
A flat yield curve, with minimal difference between short-term and long-term interest rates, could signal a potential economic slowdown. This shape of the yield curve may reflect uncertainty in the market or expectations of subdued growth. Lending activities may decrease as banks find it less profitable to lend in such conditions. Investors may also become cautious, leading to lower investment levels.
Inverted Yield Curve
An inverted yield curve, where short-term interest rates are higher than long-term rates, has historically been a reliable indicator of an impending recession. This shape of the yield curve suggests that investors are expecting economic challenges ahead, leading to a rush for safer long-term investments. Lending activities may decline, and businesses may become more conservative in their spending, preparing for tougher times.
Yield Curve as a Predictive Tool
When it comes to analyzing economic trends, the yield curve is often used as a predictive tool by analysts and investors. By understanding how changes in the yield curve can signal potential shifts in the economy, stakeholders can make informed decisions regarding investments and financial strategies.
Using the Yield Curve for Predictions
One way analysts use the yield curve as a predictive tool is by looking at the relationship between short-term and long-term interest rates. In a healthy economy, long-term interest rates are typically higher than short-term rates. When the yield curve inverts, with short-term rates surpassing long-term rates, it is often seen as a precursor to an economic downturn. This inversion has historically been associated with predicting recessions.
For example, prior to the 2008 financial crisis, the yield curve inverted, signaling an impending economic downturn. Similarly, in 2019, the yield curve inverted once again, raising concerns about a possible recession in the near future.
Limitations and Risks
- While the yield curve can provide valuable insights into potential economic trends, it is not foolproof. There have been instances where an inverted yield curve did not lead to a recession.
- Additionally, changes in monetary policy, market dynamics, and external factors can impact the predictive power of the yield curve. It is essential for analysts to consider a wide range of economic indicators and data points when making forecasts.
- Relying solely on the yield curve for predictions can be risky, as it may not account for all variables affecting the economy. It is important to use the yield curve as one of many tools in economic analysis and forecasting.
In conclusion, understanding the yield curve is crucial for navigating the financial landscape, empowering investors with valuable insights and foresight.
Essential FAQs
What is a yield curve?
A yield curve is a graphical representation of interest rates on bonds of varying maturities.
How is the yield curve used to gauge the economic outlook?
The shape of the yield curve can indicate whether the economy is heading towards growth or recession.
What factors influence the shape of the yield curve?
Economic indicators, market expectations, and investor sentiment all play a role in shaping the yield curve.


